Shopify glossaryGlossary3 min read
What Is Conversion Rate (and What's a Good One)?
Conversion rate is the share of store visits that end in a purchase. Here is how Shopify calculates it, what the averages look like and how to read your own number.
Key takeaways
- Ecommerce conversion rate is the percentage of sessions that end in a completed purchase.
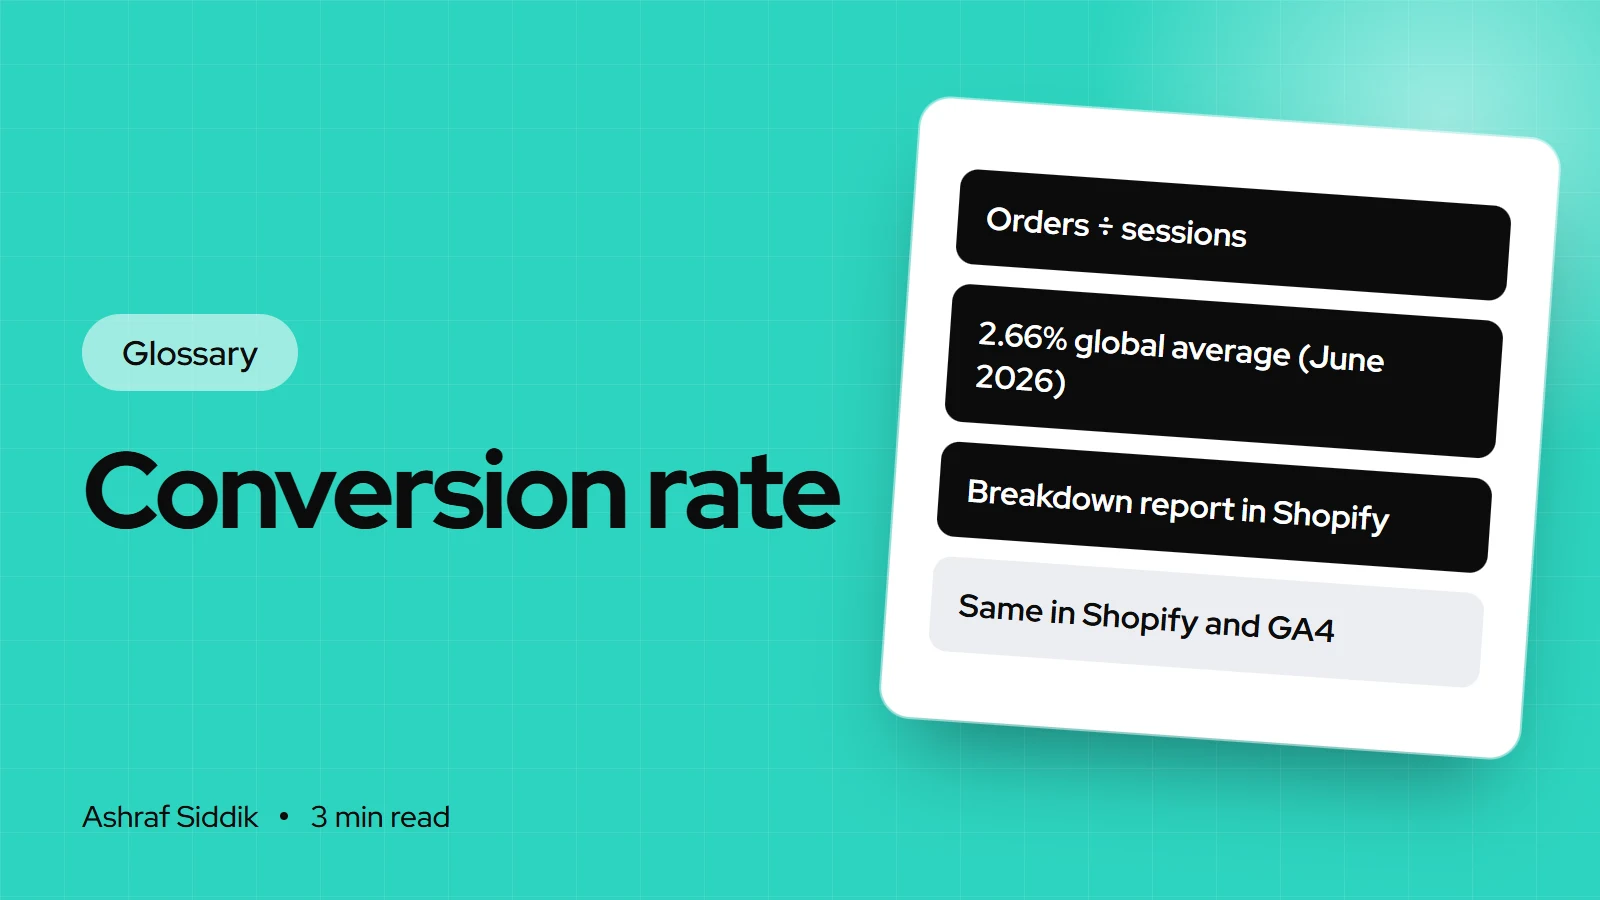
- Shopify calculates it as sessions that completed checkout ÷ sessions, and shows it in the Conversion rate over time and Conversion rate breakdown reports.
- Dynamic Yield's June 2026 data, as reported by Shopify in August 2026, puts the global average at 2.66%, with wide gaps by industry.
- Compare your rate with your own past, split by device and traffic source, before comparing it with anyone's average.
- Who it is for
- Store owners judging performance
- Time needed
- 3 minutes to read
- What you need
- Your Shopify reports
Ecommerce conversion rate is the percentage of visits to your store that end in a purchase. Shopify counts it per session: if your store had 10,000 sessions last month and 230 of them completed checkout, your conversion rate was 2.3%.
It's the number most store owners ask me about first, and the one most often misread. Conversion rate on its own doesn't tell you whether a store is doing well. It tells you how efficiently it turns visits into orders, which is the starting point for any CRO work. Definitions and benchmarks were checked on 7 November 2026.
How conversion rate is calculated
Conversion rate = sessions that completed checkout ÷ total sessions × 100
Shopify defines it as the percentage of online store visits (sessions) that resulted in a sale. A session is one visit, and it ends after 30 minutes of inactivity. One person who visits three times counts as three sessions, which is why rates based on sessions are lower than rates based on unique visitors.
Shopify also only counts sessions from visitors who accept cookies through the consent banner. If many of your visitors decline, your session count drops and the conversion rate can look higher than it really is.
A worked example with the funnel
Shopify's Conversion rate breakdown report splits the rate into three steps. Here is one illustrative month:
| Step | Sessions | Rate |
|---|---|---|
| All sessions | 10,000 | 100% |
| Added to cart | 700 | 7.0% of sessions |
| Reached checkout | 380 | 3.8% of sessions |
| Completed checkout | 230 | 2.3% conversion rate |
The breakdown is more useful than the headline. In this example, 61% of people who reached checkout bought (230 ÷ 380), which Shopify calls checkout conversion rate. The bigger loss is between product page and cart: 93% of sessions never added anything. That points to product pages, pricing or traffic quality, not checkout.
What's a good ecommerce conversion rate?
Shopify's August 2026 guide to ecommerce conversion rate reports these averages from Dynamic Yield, dated June 2026:
| Industry | Average rate |
|---|---|
| All industries | 2.66% |
| Beauty and personal care | 5.32% |
| Food and beverage | 4.58% |
| Fashion and apparel | 2.77% |
| Consumer goods | 1.76% |
| Home and furniture | 1.29% |
| Luxury and jewelry | 0.63% |
The same Shopify guide cites Contentsquare's 2026 Digital Experience Benchmark report: retail conversion of 3.7% on desktop and 2% on mobile. Different sources measure differently, so use these as a rough range. A $40 consumable and a $2,000 sofa will never convert alike. My conversion rate benchmarks guide goes deeper by category and device.
Where to find it in Shopify and GA4
- Shopify. Go to
Analytics > Reportsand open Conversion rate over time or Conversion rate breakdown. Sessions by device and Sessions by landing page help you find where the rate drops. - GA4. Mark
purchaseas a key event, then use the Session key event rate metric, which GA4 defines as the percentage of sessions that converted. It won't match Shopify exactly because the two tools count sessions differently.
Common mistakes
- Chasing an industry average. Your own trend, by device and source, matters more.
- Ignoring order value. A higher rate from heavy discounting can mean less money. Watch revenue per visitor too.
- Blending traffic. A surge of cheap social traffic lowers the rate without anything on the site getting worse.
- Calling a change too early. A week of data at 200 orders can swing by chance.
Related terms
- Average order value: the other half of revenue per visitor.
- Revenue per visitor: conversion rate × AOV.
- Conversion rate optimization (CRO): the practice of raising this number through research and testing.
- Add-to-cart rate: sessions with a cart addition ÷ sessions.
What to do next
- Open Conversion rate breakdown for the last 90 days and find the step with the biggest drop.
- Split it by device. Mobile usually has the most room to improve.
- Work through my CRO audit checklist, or have me review the store. My Shopify CRO service starts from $500.
Free tools
Check your own store
Free, no sign-up. Each one runs a part of this guide for you.
Frequently asked questions
What is ecommerce conversion rate?
It is the percentage of store visits (sessions) that end in a completed purchase. 230 orders from 10,000 sessions is a 2.3% conversion rate.
What is the average ecommerce conversion rate?
Dynamic Yield's June 2026 data, as reported by Shopify in August 2026, puts the global average at 2.66%. Industry averages ranged from 0.63% for luxury and jewelry to 5.32% for beauty and personal care.
How does Shopify calculate conversion rate?
Shopify divides sessions that completed checkout by total sessions. It only counts sessions from visitors who accept cookies, and a session ends after 30 minutes of inactivity.
Why is my conversion rate different in GA4 and Shopify?
The two tools count sessions differently and handle consent, bots and cross-domain checkout differently. Pick one as your source of truth and compare trends within it.
What is a good conversion rate for a Shopify store?
It depends on your category, price point and traffic mix. Compare against your own history and your industry range, and judge changes on revenue per visitor as well as conversion rate.
Sources
- Shopify analytics fields, Shopify Help Center
- Behavior reports, Shopify Help Center
- Ecommerce Conversion Rate, Shopify
- [GA4] Analytics dimensions and metrics, Google Analytics Help
Related services and work

I'm a Shopify developer and CRO specialist. I have built and improved Shopify stores since 2018, completed more than 1,000 projects, and hold a 4.96 average rating across 719 client reviews.
More guides
-
Why Shopify Stores Lose Sales on Mobile: A Practical CRO Checklist
Mobile visitors decide fast, with one thumb and plenty of distractions. Here is how to find the leaks on a Shopify store and fix them in the right order.
-
Shopify CRO Audit Checklist for DTC Brands
The checklist I use to audit DTC Shopify stores, from checking that the data can be trusted to deciding which fixes to ship first.
-
When to Build a Custom Shopify App Instead of Adding Another Subscription
Another subscription is the quickest fix, until you are paying for five apps that still don't match how your business works. Here is how to decide.
-
How to Find Out What Theme a Shopify Store Uses
Every Shopify store names its theme in the page code. Here is where to look, how to read what you find, and what it means for your own theme choice.
-
How to See What Apps a Shopify Store Uses
Apps leave traces in a store's page code: scripts from their own servers, app embed folders and pixel settings. Here is how to read them, and what to do with the list.
-
How to Name a Shopify Store (and Check the Name Is Free)
A store name has to be easy to say, free as a domain and a handle, and clear of other brands. Here is the process I use with clients, and what Shopify lets you change later.