Shopify glossaryGlossary4 min read
What Is MER (Marketing Efficiency Ratio)? Formula and How to Use It
MER is your store's total revenue divided by total marketing spend. Here is how to calculate it, how to find the MER your margin needs, and why it is the reality check on ad platform numbers.
Key takeaways
- MER = total revenue ÷ total marketing spend. $40,000 in sales on $10,000 of marketing is a MER of 4.
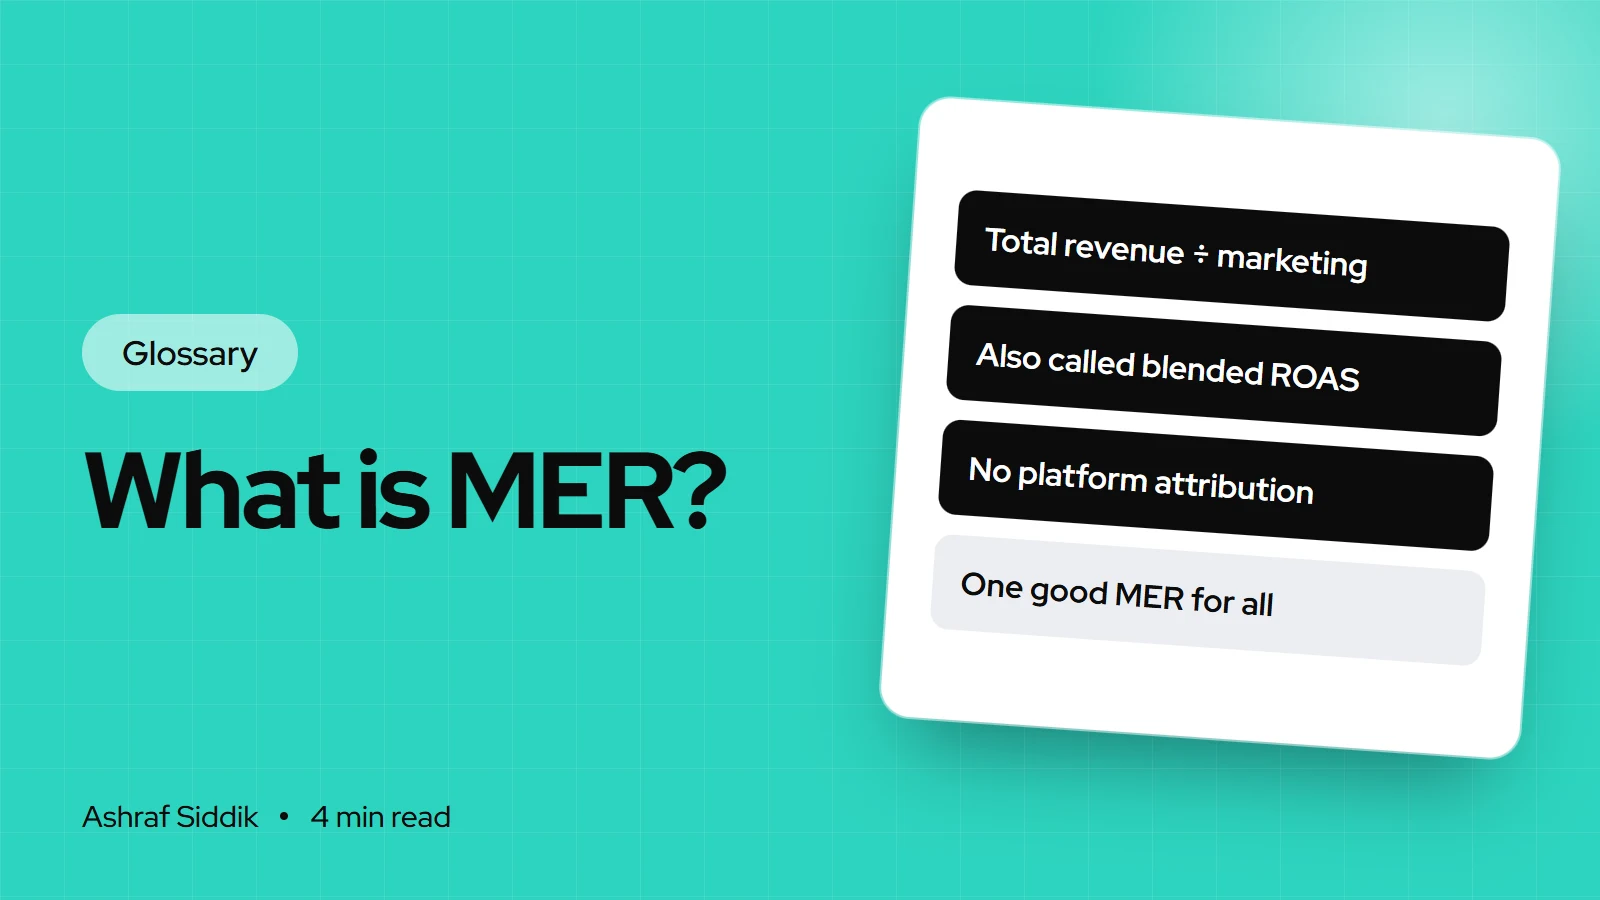
- MER uses all store revenue, so it doesn't depend on any ad platform's attribution. It is also called blended ROAS.
- Your break-even MER is 1 ÷ your margin after variable costs. Work it out before deciding whether a MER is good.
- Raising conversion rate and repeat orders lifts total revenue for the same spend, so store work shows up directly in MER.
- Who it is for
- Stores spending across several channels
- Time needed
- 4 minutes to read
- What you need
- Total sales and marketing spend
Marketing efficiency ratio (MER) is your store's total revenue divided by your total marketing spend over the same period. If you made $40,000 in sales and spent $10,000 on marketing last month, your MER is 4.
Shopify describes MER as a metric that compares total revenue with total marketing spend, and notes it is also called blended ROAS. The appeal is simple. Each ad platform claims its own sales, and those claims overlap. MER skips that argument by using what actually landed in your Shopify admin. I don't run ads, but MER is the number I'd watch first if I were judging whether paid traffic and the store are working together. Checked on Shopify's help pages and Shopify's own MER article on 7 November 2026.
How to calculate marketing efficiency ratio
MER = total revenue ÷ total marketing spend
- Revenue: all store sales in the period, from every channel. Pick total sales or net sales from Shopify analytics and use the same one every month. Net sales, after discounts and returns, is the safer choice.
- Marketing spend: Shopify's article lists paid ads, influencer fees, creative production, marketing tools and agency or contractor costs. Some teams count media spend only. Either works if you stay consistent.
A worked example
One month at an illustrative store
- Net sales$40,000From Shopify analytics, all channels.
- Marketing spend$10,000Ads, creators and tools.
- MER4.0$40,000 ÷ $10,000.
- Break-even MER2.5At a 40% margin after product, shipping and fees.
At a 40% margin after variable costs, $40,000 of sales leaves $16,000. Take away $10,000 of marketing and $6,000 is left for overheads and profit. Break-even MER is 1 ÷ 0.40 = 2.5, so this store has room. If MER slid to 2.5, marketing would be eating the whole margin.
Now say the store lifts conversion rate by a fifth on the same traffic. Sales rise to about $48,000, MER to 4.8, and the money left after marketing to about $9,200. No extra ad spend was involved.
MER vs ROAS
| Metric | Revenue counted | Spend counted | Best for |
|---|---|---|---|
| MER | All store sales | All marketing | Whole-store health |
| ROAS | Sales an ad platform attributes | One campaign or channel | Campaign decisions |
| POAS | Gross profit from ad orders | One campaign or channel | Profit by campaign |
Use ROAS to choose between campaigns and MER to check whether all of it adds up.
Where to find the numbers in Shopify
- Revenue:
Analytics > Reports. Use your sales reports for total or net sales for the period. - Ad spend: the
Performance by marketing channelreport shows ad spend for channels that report cost data to Shopify. Add anything that doesn't, such as creator fees and tools, from your own records. - Margin: with cost per item set on your products, Shopify's profit reports show gross profit as net sales minus cost.
Common misconceptions
- Chasing a MER someone else quoted. A good MER depends on your margin. A 70% margin brand and a 30% margin brand need very different numbers.
- Changing what counts as spend. Add salaries one month and drop them the next, and the trend means nothing.
- Ignoring repeat customers. MER includes sales from returning buyers, so a store with strong retention shows a higher MER even when new-customer acquisition is expensive.
MER hides channel detail on purpose. When it falls, it won't tell you which campaign caused it. That is when you go back to ROAS and CPA by channel, and to your store's conversion rate, to find where the drop started.
Related terms
- CPA: ad spend ÷ conversions, the per-order cost behind MER.
- Attribution window: the reason platform numbers overlap and MER doesn't.
- ROAS, POAS and customer lifetime value.
What to do next
- Calculate MER for the last six months with one fixed definition of spend.
- Set your break-even MER from your margin after product, shipping and fees. My guide to ecommerce KPIs shows how MER fits with the rest.
- Lift revenue per visitor. My Shopify CRO work starts from $500 and begins with a free store review.
Free tools
Check your own store
Free, no sign-up. Each one runs a part of this guide for you.
Frequently asked questions
How do you calculate marketing efficiency ratio?
Divide total store revenue by total marketing spend for the same period. For example, $90,000 in sales on $30,000 of marketing gives a MER of 3.
What is a good marketing efficiency ratio?
A good MER is comfortably above your break-even MER, which is 1 divided by your margin after product, shipping and payment costs. With a 40% margin, break-even is 2.5. There is no single figure that suits every store.
Is MER the same as ROAS?
No. ROAS uses the revenue a platform attributes to specific ads. MER uses all store revenue against all marketing spend, which is why it is also called blended ROAS.
What counts as marketing spend in MER?
At minimum, paid media. Many stores also include influencer fees, creative production, marketing tools and agency costs. Choose a definition and keep it the same so the trend stays comparable.
Why is my MER lower than my ad platform ROAS?
Ad platforms can each claim the same order, and their ROAS only counts attributed sales against their own spend. MER counts every sale once against every cost, so it is usually the more sober number.
Sources
- Marketing Efficiency Ratio: How To Calculate + Improve MER, Shopify
- Marketing reports, Shopify Help Center
- Profit reports, Shopify Help Center
Related services and work

I'm a Shopify developer and CRO specialist. I have built and improved Shopify stores since 2018, completed more than 1,000 projects, and hold a 4.96 average rating across 719 client reviews.
More guides
-
Why Shopify Stores Lose Sales on Mobile: A Practical CRO Checklist
Mobile visitors decide fast, with one thumb and plenty of distractions. Here is how to find the leaks on a Shopify store and fix them in the right order.
-
Shopify CRO Audit Checklist for DTC Brands
The checklist I use to audit DTC Shopify stores, from checking that the data can be trusted to deciding which fixes to ship first.
-
When to Build a Custom Shopify App Instead of Adding Another Subscription
Another subscription is the quickest fix, until you are paying for five apps that still don't match how your business works. Here is how to decide.
-
How to Find Out What Theme a Shopify Store Uses
Every Shopify store names its theme in the page code. Here is where to look, how to read what you find, and what it means for your own theme choice.
-
How to See What Apps a Shopify Store Uses
Apps leave traces in a store's page code: scripts from their own servers, app embed folders and pixel settings. Here is how to read them, and what to do with the list.
-
How to Name a Shopify Store (and Check the Name Is Free)
A store name has to be easy to say, free as a domain and a handle, and clear of other brands. Here is the process I use with clients, and what Shopify lets you change later.