Shopify glossaryGlossary4 min read
What Is a Heatmap? How Shopify Stores Use Click and Scroll Maps to Lift Conversions
A website heatmap shows where visitors click, how far they scroll and what they ignore, using color. Here is how to read one and how to set it up on a Shopify store.
Key takeaways
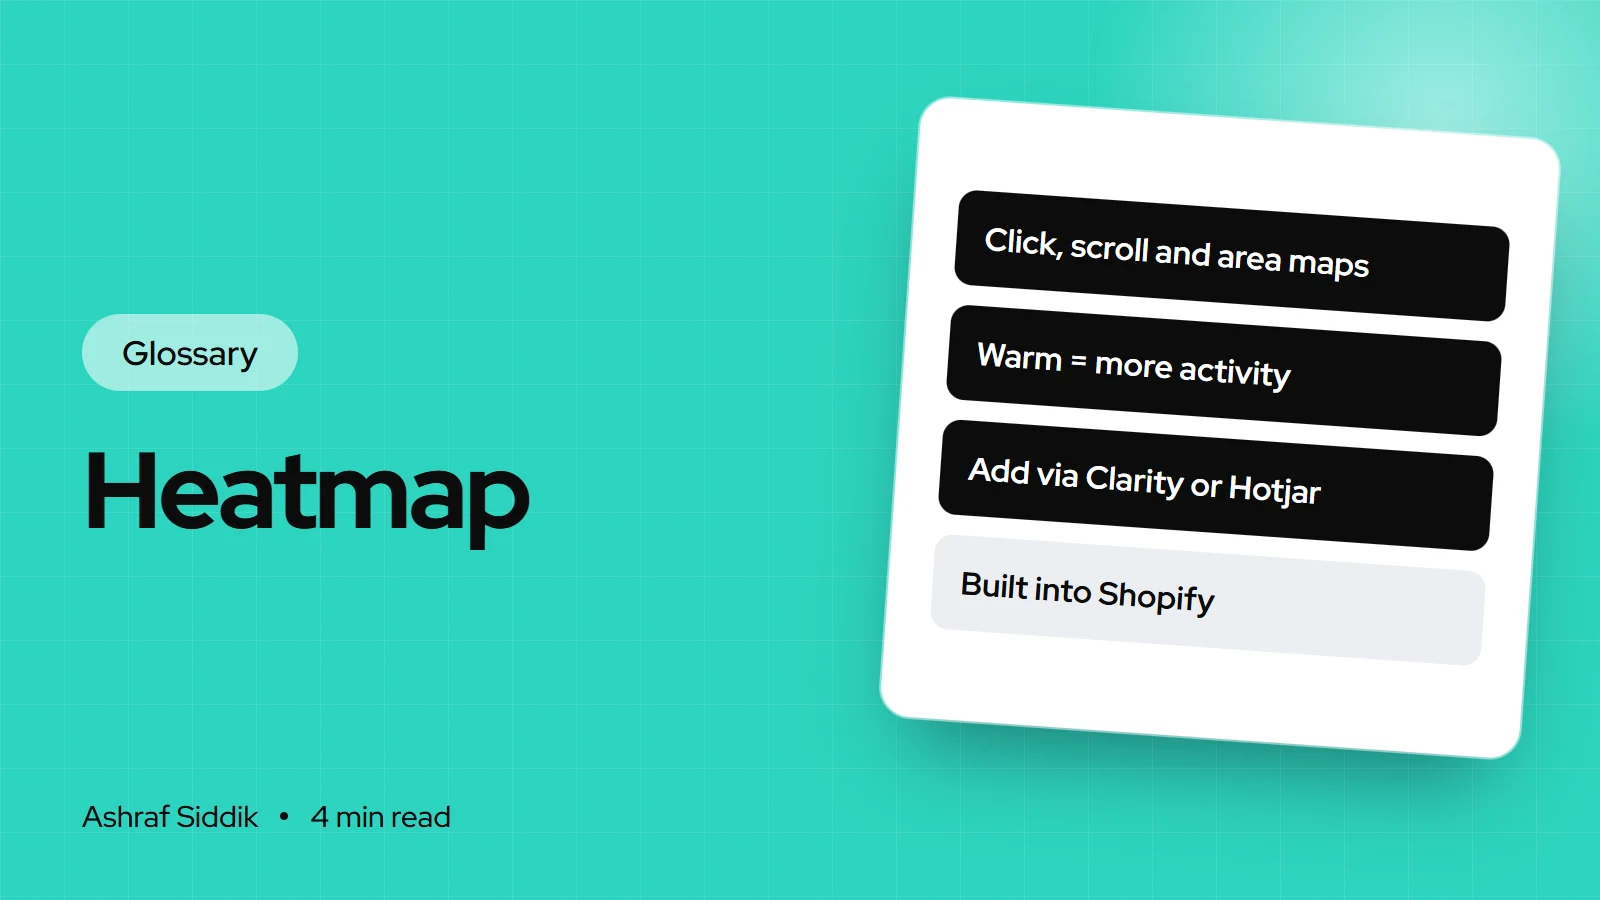
- A website heatmap is a color overlay of a page that shows aggregated visitor behavior: warm colors for heavy activity, cool colors for little.
- The main types are click maps, scroll maps, area maps and attention maps. Scroll maps answer the most common question: did people even see it?
- Shopify has no built-in heatmaps. You add a tool such as Microsoft Clarity or Hotjar to the theme or through its app.
- Heatmaps show what happens, not why or whether a change would sell more. Use them to find problems, then test the fix.
- Who it is for
- Store owners finding page problems
- Time needed
- 4 minutes to read
- What you need
- A heatmap tool and two weeks
A website heatmap is a visual overlay of a page that uses color to show how visitors interact with it. Warm colors mark the areas that get the most clicks, scroll reach or attention, and cool colors mark the parts people skip.
On most CRO projects, a heatmap is one of the first things I set up, because it settles arguments quickly. If 70% of mobile visitors never scroll far enough to see your reviews, no amount of review styling will matter. Tool details below come from Microsoft's Clarity documentation, checked on 7 November 2026.
The main types of heatmap
| Type | Shows | Best question it answers |
|---|---|---|
| Click map | Clicks per element | Are people clicking the right things? |
| Scroll map | How far visitors scroll | Did they see the key content? |
| Area map | Clicks inside a region you draw | Is this whole block working? |
| Attention map | Time spent on each part | What do people actually read? |
| Conversion map | Clicks linked to purchases | Which clicks lead to sales? |
Clarity also filters click maps into dead clicks (clicks with no response) and rage clicks (fast repeated clicks in one spot). On product pages, dead clicks on images or text that look clickable are among the most useful findings, because they show where shoppers expected something to happen.
Reading a scroll map: a worked example
The key figure on a scroll map is scroll reach: visitors who reached a point ÷ visitors who loaded the page × 100. Clarity shows it in 5% steps of page height, with the drop-off at each step. Here is an illustrative mobile product page:
Mobile product page, 8,000 page views (illustrative)
- Add to cart button92%Reached; sits near the top.
- Size guide link55%Reached; below a long description.
- Delivery and returns38%Reached; in a tab halfway down.
- Customer reviews24%Reached; at the very bottom.
What I'd take from this: three in four visitors never see a review, and most never see delivery and returns. Those are exactly the details that answer buying doubts. A review summary and a one-line delivery promise near the price are the obvious hypotheses to test.
How to add heatmaps to Shopify
- Choose a tool. Microsoft Clarity and Hotjar both offer heatmaps and session recordings, and both can be installed through an app or by adding a tracking code to your theme.
- Respect consent. In the UK and EU, behavior tracking tools need visitor consent, so load them through your cookie banner.
- Segment by device. Always view mobile and desktop separately. A mobile page is a different, much longer page.
- Wait for data. Clarity says there's no minimum traffic needed to generate a heatmap, but I want a few thousand page views per template before drawing conclusions.
My guide on using heatmaps to improve your store walks through a full review, page by page.
Common mistakes
- Mixing devices. A blended map hides mobile problems behind desktop behavior.
- Treating a heatmap as proof. "Nobody clicks it" doesn't mean removing it will raise sales. Test the change.
- Looking only at the home page. Product, collection and cart pages usually matter more for revenue.
- Ignoring session recordings. A rage-click hotspot makes sense once you watch five recordings of it.
Related terms
- A/B testing: how you check whether a fix you found in a heatmap really works.
- Bounce rate: pages with high bounce rates are good candidates for a heatmap review.
- Conversion rate optimization: the process heatmaps feed into.
- Session recording: a replay of one visitor's session, the qualitative partner to a heatmap.
What to do next
- Install a heatmap tool behind your cookie banner.
- Review your top product page on mobile after two weeks: scroll reach to reviews and delivery, and dead clicks.
- Turn each finding into a hypothesis and test the biggest one first.
Free tools
Check your own store
Free, no sign-up. Each one runs a part of this guide for you.
Frequently asked questions
What is a heatmap for a website?
It is a color overlay of a page showing where visitors click, how far they scroll and where they spend time. Warm colors mean more activity and cool colors mean less.
What are the types of website heatmaps?
The main types are click maps, scroll maps, area maps and attention maps. Microsoft Clarity also offers conversion maps on sites where it detects purchase events.
Does Shopify have built-in heatmaps?
No. You add a tool such as Microsoft Clarity or Hotjar through an app or by adding its tracking code to your theme.
How much traffic do I need for a heatmap?
Clarity says there is no minimum traffic needed to generate one. For decisions, I like a few thousand page views per page template, viewed separately for mobile and desktop.
Are heatmaps allowed under GDPR?
They can be used, but in the UK and EU behavior tracking tools need visitor consent. Load them through your cookie consent banner and mask personal data in recordings.
Sources
- Heatmaps overview, Microsoft Learn (Clarity)
- Scroll maps, Microsoft Learn (Clarity)
Related services and work

I'm a Shopify developer and CRO specialist. I have built and improved Shopify stores since 2018, completed more than 1,000 projects, and hold a 4.96 average rating across 719 client reviews.
More guides
-
Why Shopify Stores Lose Sales on Mobile: A Practical CRO Checklist
Mobile visitors decide fast, with one thumb and plenty of distractions. Here is how to find the leaks on a Shopify store and fix them in the right order.
-
Shopify CRO Audit Checklist for DTC Brands
The checklist I use to audit DTC Shopify stores, from checking that the data can be trusted to deciding which fixes to ship first.
-
When to Build a Custom Shopify App Instead of Adding Another Subscription
Another subscription is the quickest fix, until you are paying for five apps that still don't match how your business works. Here is how to decide.
-
How to Find Out What Theme a Shopify Store Uses
Every Shopify store names its theme in the page code. Here is where to look, how to read what you find, and what it means for your own theme choice.
-
How to See What Apps a Shopify Store Uses
Apps leave traces in a store's page code: scripts from their own servers, app embed folders and pixel settings. Here is how to read them, and what to do with the list.
-
How to Name a Shopify Store (and Check the Name Is Free)
A store name has to be easy to say, free as a domain and a handle, and clear of other brands. Here is the process I use with clients, and what Shopify lets you change later.